Charting software plays a vital role for traders and investors who rely on technical analysis to evaluate securities and make informed decisions. With advanced charting capabilities and a wealth of analytical tools, this software has become an essential component of financial analysis. However, as technology evolves, the technical aspects and capabilities of charting software also advance.
The Importance of Charting Software
Technical analysis utilizes historical price and volume data to forecast future price movements and identify trends and patterns. Over 90% of traders and investors rely on some form of technical analysis to inform their trading strategies and investments. Charting software gives analysts the ability to visualize this data through charts and graphs, and also provides a range of indicators and analytical tools. This enables more effective technical analysis as well as backtesting of trading systems.
Some key benefits of using charting software include:
- Customizable charts with price, volume, indicators etc. This allows traders to plot the specific data they need to conduct analysis.
- Wide range of technical indicators and analytical tools. Charting software provides built-in indicators like Bollinger Bands, MACD, RSI as well as custom indicators. These reveal additional insights from the data.
- Ability to draw trendlines, support/resistance, fibonacci retracements etc. Charting tools allow traders to easily identify key technical levels and patterns on the charts.
- Backtesting trading systems across historical data allows traders to assess a strategy’s profitability before risking real capital.
- Charting software offers real-time data and alerts, notifying traders of opportunities and providing up-to-the-minute pricing data to pinpoint emerging trends and reversal signals.
The Future of Charting Software
The future of charting software holds exciting possibilities, driven by ongoing technological advancements and the ever-evolving landscape of financial markets. Here are some key trends and developments to anticipate:
Integration of Artificial Intelligence and Machine Learning
Advancements in AI and machine learning enable more sophisticated pattern recognition and predictive analytics within charting platforms. This provides traders with statistically-validated insights into the probability of certain price movements. AI can continuously scan charts to identify high-probability trade setups.
Transition to Cloud-Based Delivery
Many charting software platforms are transitioning to cloud-based delivery models. This enables users to access advanced charting capabilities through the cloud on any device. The cloud reduces hardware requirements for end users.
Increased Focus on User Customization
Leading charting software is providing traders with more options for customizing indicators, analytics, chart types, color schemes and layouts to suit their preferences and analytical needs. This allows traders to create a personalized workflow.
Technical Aspects and Capabilities
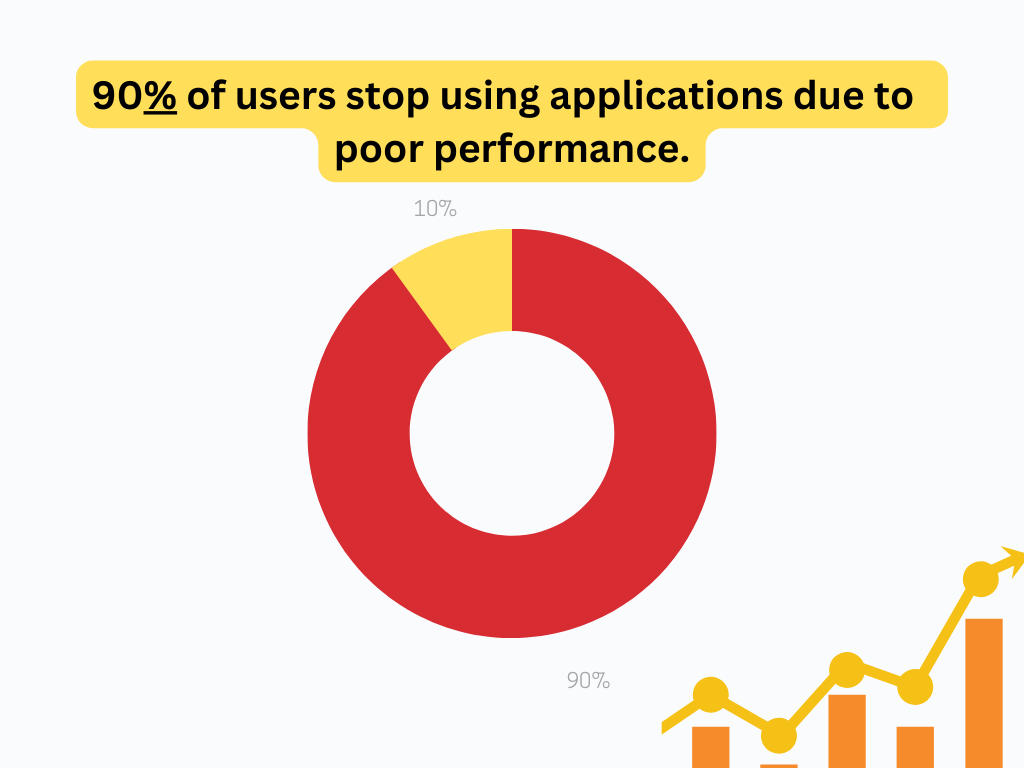
Source: UserGuiding
Charting software harnesses several essential technical components to equip traders with the tools they need for effective market analysis. These components are the backbone of any charting software, enabling it to deliver real-time and historical data in a format that is easy to interpret and act upon. These includes:
Data Feeds
Real-time or delayed data feeds provide the pricing data (Open, High, Low, Close) required to generate charts and perform technical analysis. Common data feeds include those from stock exchanges, forex brokers and cryptocurrency exchanges.
Charting Engines
These engines transform the data feeds into visual charts and graphs. Advanced charting engines offer a wide variety of chart types including candlestick, line, bar charts etc.
Analytical Tools and Indicators
Indicators like moving averages, Bollinger bands and MACD, allow for more sophisticated analysis. Charting software often includes hundreds of prebuilt indicators as well as the ability to customize indicators.
Alerts and Notifications
Alerts provide traders with real-time notifications when a defined technical event occurs, such as a breakout or crossover. This enables timely execution of trades based on technical signals.
Backtesting Capabilities
Backtesting involves applying a set of technical rules and indicators to historical charts to evaluate their efficacy. Charting software enables traders to easily backtest trading systems before risking real capital. Without backtesting, investors would not be able to propose new strategies with confidence.
The presence of a backtesting allows traders both new and old to test out investment strategies. They can then evaluate whether they would be successful or fail depending on the historical data.
They can then create new plans for future investments that are similar, or employ the same strategy if they were deemed successful.
Ease of Use and Customization
Prominent charting software platforms prioritize delivering an intuitive and highly adaptable user experience, with the user’s needs and preferences at the forefront. Traders are granted the flexibility to tailor various aspects of the software to align with their unique requirements, thereby enhancing their efficiency and overall satisfaction.
Some of the quality of life customization options that chart software can use include:
- Custom Color Schemes: This enables better visualization of charts. With the right color scheme, important points are easier to see. In addition, colorblind users can choose a color scheme that suits their individual needs.
- Chart Layouts: Custom layouts help users choose which data to see when interacting with the program. One can then choose which charts to prioritize and display.
- Custom Indicators: Custom indicators are designed to focus on specific market aspects or trading signals that are not adequately covered by the prebuilt indicators. Traders can create these indicators to capture unique patterns or conditions they believe are vital for their strategy.
- Custom Hotkeys: Custom hotkeys can be assigned to a wide range of functions and actions within the software. Common examples include opening or closing charts, placing orders, switching between timeframes, and toggling technical indicators on and off. The choice of actions is highly flexible and based on the user’s needs. This enables users to take quicker action on investment decisions.
Together, these technical components give traders the arsenal they need to navigate the intricate landscape of financial markets.
Frequently Asked Questions
What technical aspects are most important for charting software?
The most critical technical capabilities include flexible charting engines, robust indicator libraries, backtesting tools, customizable layouts and alerts.
How can charting software improve my trading outcomes?
Charting software provides the analytical tools and real-time data to quickly identify trading opportunities, develop systematic strategies, and make informed decisions. This can lead to improved profitability.
What common mistakes should I avoid with charting software?
Avoid overcomplicating analysis with too many indicators, failing to backtest strategies, ignoring risk management principles, and not customizing to suit your trading style.
Conclusion
Charting software is continuously evolving. Traders can expect greater integration of AI and blockchain in user-centric software designs.These new technologies will give traders better tools for analyzing data, which in turn will help them create more effective trading strategies and improve their overall performance. However, despite these technological leaps, human interpretation of data remains a cornerstone of technical analysis.